
Retirement is, for some, an elusive phase of life that appears a distant dream. For others, it’s an inevitable break from working life that’s just around the bend. For others still, it’s an everyday reality. But whether you’re reaching for retirement or you’ve already arrived, some facts remain the same: you need money, and you need enough of it to meet your lifestyle goals.
Looking through our research on today’s most compelling retirement statistics, a few things are obvious. Chiefly, in pursuing retirement, you must work with what you know. We know some Americans are living longer and spending more in retirement, whether on healthcare, travel, or activities to fill newfound free time. We also know that most American workers shoulder the burden of saving on their own. Many contemporary employers don’t offer pensions, and social security can feel like a precarious gamble if it represents a majority of your income.
The reality? Today’s hopeful retirees may need to make tough choices and balance their enjoyment today, with their preparation for a better future tomorrow (even a future that may feel hazy). We can almost guess what you’re thinking: This is simple advice, but simple doesn’t always mean easy.
Nevertheless, we at Curio Wealth know that it is possible.
The Top Interesting Retirement Statistics
Thankfully, these retirement statistics only describe the big picture, averages of large groups of surveyed individuals. Your final retirement plan is unique to you, and that’s all that matters. So, start saving now. it’s never too late.
And with that, we’ll reveal our research on the most eye-opening retirement statistics, the ones that may illuminate different perspectives on retirement realities.
Age
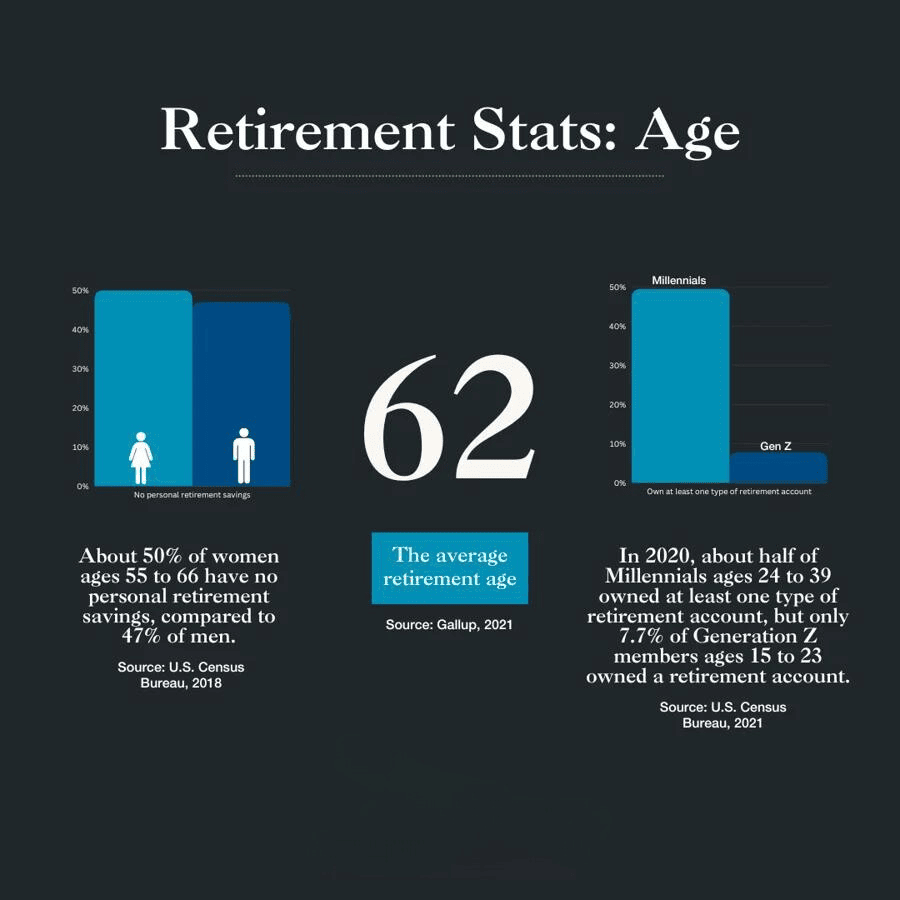
- The average retirement age in the U.S. is 62. (Gallup, 2021)
- 50.3% of U.S. adults aged 55 and older said they were retired as of the third quarter of 2021, up from 48.1% in the same quarter in 2019. (Pew Research Center, 2021)
- 66.9% of adults aged 65 to 74 were retired in the third quarter of 2021, compared with 64.0% in the same quarter of 2019. (Pew Research Center, 2021)
- The number of Americans 65 and older will increase from about 57 million in 2021 to about 76 million by 2035, predicts the Social Security Administration. (Social Security Administration, 2021)
- About 15% of workers aged 65 and older had been with their employer for two years or less in 2018. (U.S. Bureau of Labor Statistics, 2019)
- 55% of women expect to retire after age 65 or do not plan to retire. (Transamerica Center, 2019)
- Among women who plan to work past age 65 and/or in retirement, more cite doing so for financial reasons (84%) than health-related reasons (69%). (Transamerica Center, 2019)
- Some women are likely not being proactive enough to work past age 65. Only 48% say they are staying healthy, 44% are focused on performing well at their current job, and only 39% are keeping their job skills up to date. (Transamerica Center, 2019)
- About 50% of women ages 55 to 66 have no personal retirement savings, compared to 47% of men. (U.S. Census Bureau, 2018)
- In 2020, working-age baby boomers ages 56 to 64 were the most likely to own at least one type of retirement account (58.1%). (U.S. Census Bureau, 2021)
- In 2020, Gen X members ages 40 to 55 were the next most likely to own retirement accounts (56.1%). (U.S. Census Bureau, 2021)
- In 2020, about half (49.5%) of Millennials ages 24 to 39 owned at least one type of retirement account, but only 7.7% of Gen Z members ages 15 to 23 owned a retirement account. (U.S. Census Bureau, 2021)
- While members of Generation Z were least likely to own a retirement account as of 2020, they also have the most time to accumulate retirement savings. According to previous work showing SIPP estimates for 2013, only 17.7% of Millennials owned retirement accounts when they were ages 15 to 31. (U.S. Census Bureau, 2021)
Global Retirement
- 80% of individuals (including 77% of surveyed business owners) believe companies should be responsible for helping them achieve a secure retirement. (Natixis, 2021)
- 80% of individuals say they would be more inclined to work for a company that offered matching contributions to their retirement savings plan. (Natixis, 2021)
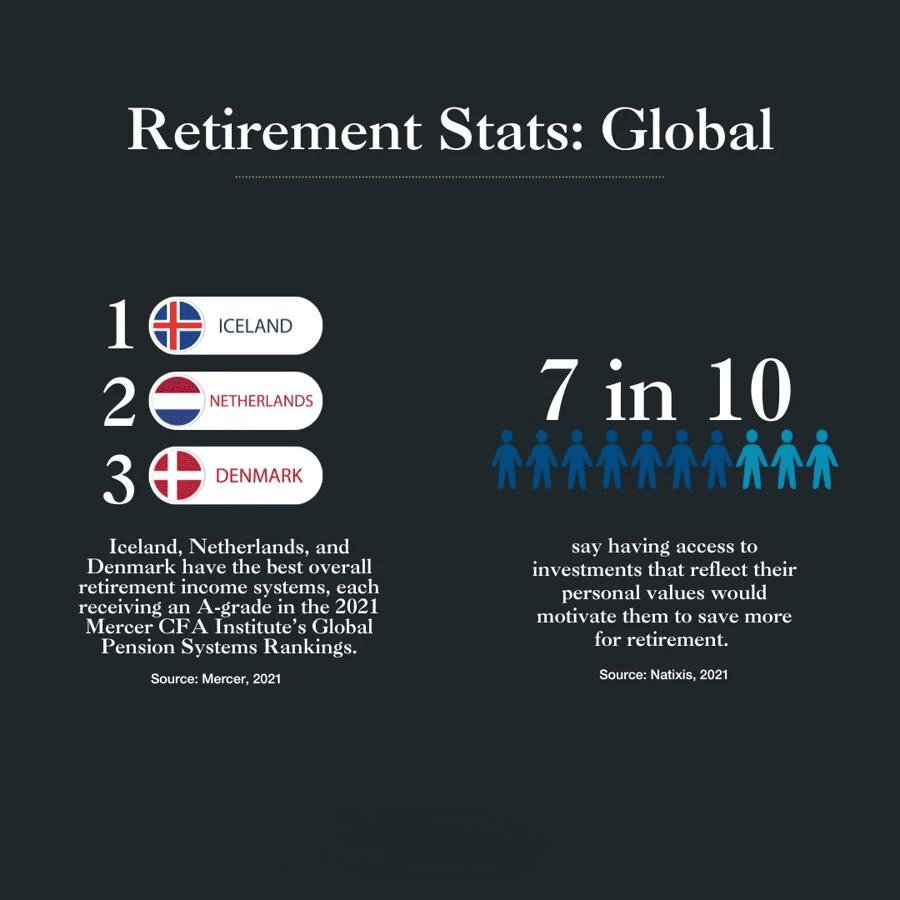
- Seven in ten say having access to investments that reflect their personal values would motivate them to save more for retirement. (Natixis, 2021)
- 62% of individuals surveyed globally say they need professional advice selecting investments in their retirement plan. (And this is a group where more than half rate their investment knowledge as strong, and 62% say they understand the investments available in their retirement plan.) (Natixis, 2021)
- More than three-quarters (78%) of individuals say that the responsibility of funding for retirement is falling squarely on their shoulders. (Natixis, 2021)
- Iceland (#1), Netherlands (#2) and Denmark (#3) have the best overall retirement income systems, each receiving an A-grade in the 2021 Mercer CFA Institute’s Global Pension Systems Rankings. (Mercer, 2021)
- The United States, which is the leading country in terms of pension fund assets, has retirement assets worth around ten times as much as the second largest pension market, which is the United Kingdom. (Statista, 2020)
Housing
- The 2010 census found that 3.1% of seniors were nursing home residents. (U.S. Bureau of Labor Statistics, 2010)
- Retirees can choose from about 5,000 continuing care retirement communities in the U.S. Some of these senior communities cater to tenants as young as 50. (U.S. Bureau of Labor Statistics, 2010)
- Senior housing occupancy in the United States reached a record low of 78.8% in the first quarter of 2021, falling 1.8 percentage points from the last quarter of 2020 and 8.7 percentage points from a year ago. (NIC, 2021)
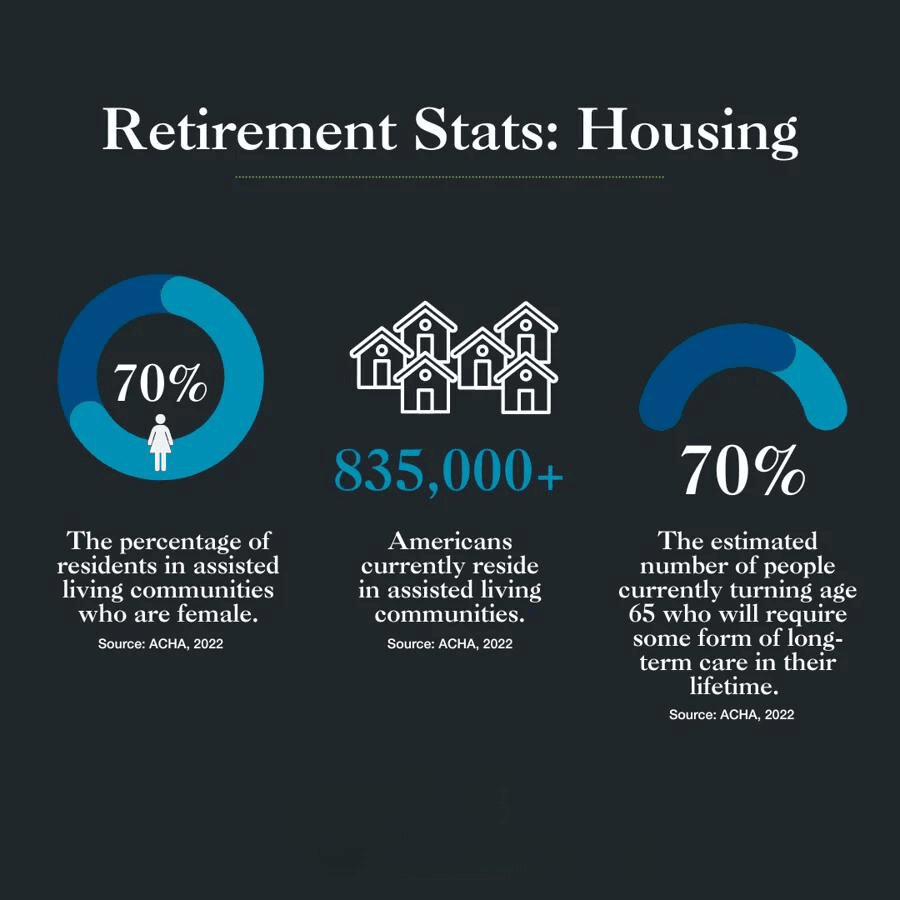
- More than 835,000 Americans currently reside in assisted living communities. (AHCA, 2022)
- According to the demographics, the majority of these residents are white females age 85 or older. (AHCA, 2022)
- 70% of residents at assisted living communities are female. (AHCA, 2022)
- An assisted living resident’s average length of stay is around 22 months, after which he or she will move to a nursing facility for a higher level of care. (AHCA, 2022)
- Currently, around one million Americans live in some type of senior living community, and that number is expected to double by the year 2030. (AHCA, 2022)
- By the year 2040, the 85+ population is expected to reach 14.1 million, triple the 5.7 million there were in 2011. (AHCA, 2022)
- An estimated 70% of people currently turning age 65 will require some form of long-term care in their lifetime. (AHCA, 2022)
Life In Retirement
- 29% of Americans believe their lifestyle in retirement will improve. (Schwabb, 2021)
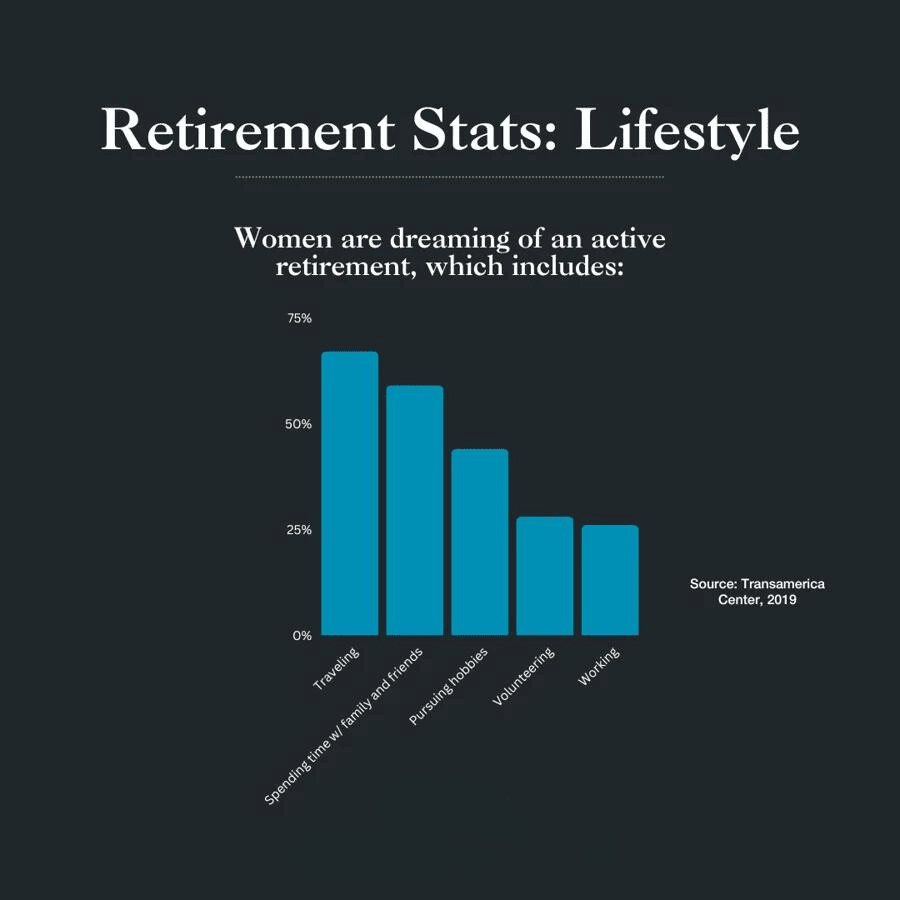
- Women are dreaming of an active retirement, including traveling (67%), spending more time with family and friends (59%), pursuing hobbies (44%), volunteering (28%), and working (26%). (Transamerica Center, 2019)
- 54% of women plan to work after they retire, either full time (12%) or part time (42%). (Transamerica Center, 2019)
- In a 2021 survey, the actual mean retirement age for retirees was 62 and, according to the Center for Disease Control and Prevention, the current life expectancy is nearly 79. (Gallup, 2021)
- A 65-year old woman has a 50% chance of making it to age 86.5, and a 65-year old man has a 50% chance of reaching age 84 (as of January 2022). (Social Security Administration, 2022)
- A broadly diversified retirement portfolio consisting of 40% large-cap U.S. stocks, 25% small-cap U.S. stocks, 25% U.S. bonds, and 10% cash has had a 98% success rate in lasting at least 35 years during retirement before running out of money. (Twelve Advisors, 2022)
Race
- More than half of black and Latinx households have no retirement savings at all; less than a third of white households are without retirement assets. Black and Latinx households who do have savings have less allocated toward their retirement. (American Progress, 2019)
- The median retirement savings for a white household between ages 25 and 61 is $79,500. For Asian-Americans, it is $67,025. Black and Latinx households have $29,200 and $23,000, respectively. (EPI, 2019)
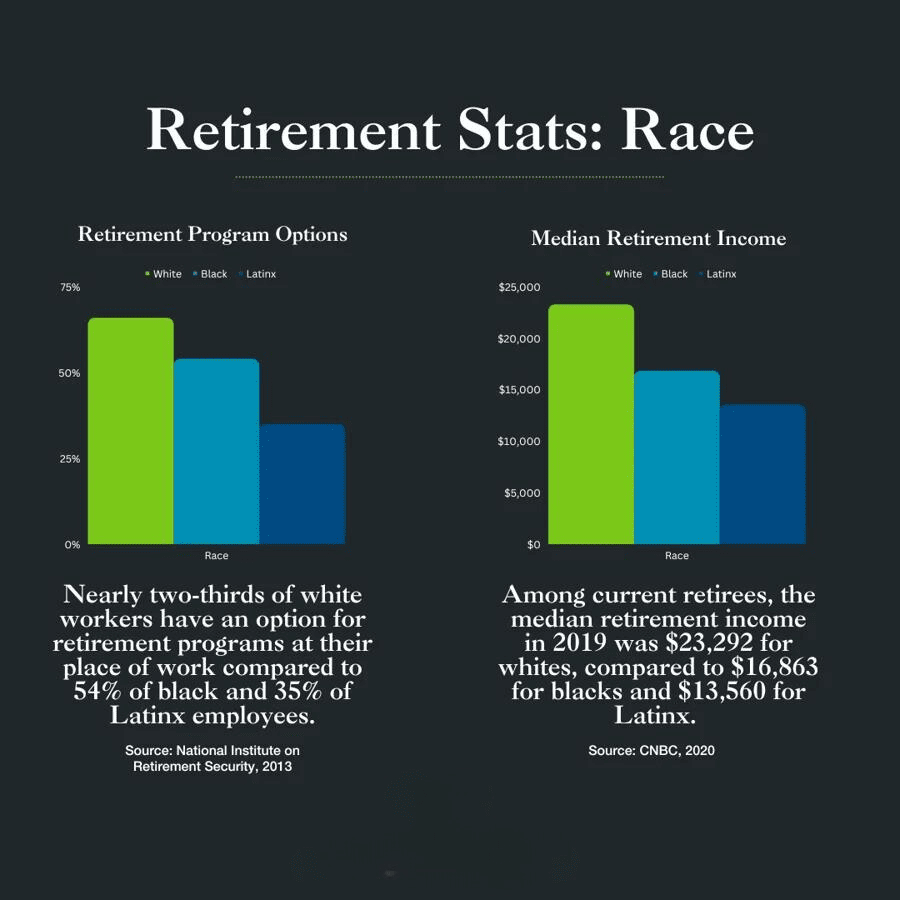
- Among current retirees, the median retirement income in 2019 was $23,292 for whites, compared to $16,863 for blacks and $13,560 for Latinx. (CNBC, 2020)
- The average annual Social Security payments to white men and women are $16,308 and $12,336, respectively, compared to $13,200 for black men and $10,800 for black women, according to a Joint Economic Committee analysis of 2018 Current Population Survey data. For Latinx beneficiaries, it’s $10,800 for men and $8,808 for women. (Senate- Joint Economic Committee, 2016)
- Nearly two-thirds of white workers have an option for retirement programs at their place of work compared to 54% of black and 35% of Latinx employees. (National Institute on Retirement Security, 2013)
- In 2016, the typical black household approaching retirement had 46% of the retirement wealth of the typical white household, while the typical Hispanic household had 49%. (Center for Retirement Research at Boston College, 2016)
- 50% of black workers aged 55 to 62 reported in 2014 that they have jobs requiring “lots of physical effort,” compared with just 32% of whites. (Sage Journals, 2019)
- Only 54% of black and Asian employees and 38% of Latino employees aged 25-64 work for an employer that sponsors a retirement plan, compared to 62% of white employees. (National Institute on Retirement Security, 2013)
- These racial disparities are much more pronounced in the private sector than in the public sector. Blacks, Asians, and Latinos are respectively 15, 13, and 42% less likely than whites to have access to a job-based retirement plan in the private sector, compared to 10, 9, and 12% less likely in the public sector. (National Institute on Retirement Security, 2013)
- Households of color lag behind white households in coverage by pensions that guarantee lifetime retirement income. While 24% of white households have a pension through a current job, only 16% of households of color do. This disparity is primarily due to the fact that just 12% of Latino households are covered by a pension plan, half the rate of white and black households. (National Institute on Retirement Security, 2013)
- A large majority of black and Latino working age households, 62% and 69%, respectively, do not own assets in a retirement account, compared to 37% of white households. (National Institute on Retirement Security, 2013)
- Households with pensions through a current job are more likely to have dedicated retirement savings in a 401(k) or IRA-type account than households without pensions: 74% versus 66%, respectively, among white households, and 52% versus 40% among households of color. (National Institute on Retirement Security, 2013)
- Three out of four black households and four out of five Latino households aged 25-64 have less than $10,000 in retirement savings, compared to one out of two white households. (National Institute on Retirement Security, 2013)
- Among near-retirees, the per-household average retirement savings balance among households of color ($30,000) is one-fourth that of white households ($120,000). (National Institute on Retirement Security, 2013)
- Across age groups, households of color with at least one earner are half as likely as white households to have retirement savings equal to or greater than their annual income. For instance, only 19% of households of color near retirement have this much retirement savings, compared to 41% of white households of the same age. (National Institute on Retirement Security, 2013)
- About 54% of non-Hispanic white individuals owned a retirement account, and 46.8% of non-Hispanic Asian individuals owned a retirement account. (U.S. Census Bureau, 2021)
Savings
- Only 12% of women are “very confident” they will be able to retire with a comfortable lifestyle. (Transamerica Center, 2019)
- On average, Americans have around $141,542 saved up for retirement. However, most people likely have much less: The median 401(k) balance is just $35,345. (Vanguard, 2022)
- Men have higher average account balances ($170,942) than women ($118,849). (Vanguard, 2022)
- Americans 65 and older have average Vanguard account balances of $279,997. That compares with $97,020 among 35- to 44-year-olds. (Vanguard, 2022)
- The average 401(k) balance as of the first quarter of 2022 was $121,700, a 2% decrease from $123,900 in the first quarter of 2021. (Fidelity, 2022)
- The average IRA balance as of the first quarter of 2022 was higher at $127,100 (also a 2% dip from the first quarter of 2021, at $130,000). (Fidelity, 2022)
- A 65-year-old couple retiring in 2022 may need about $315,000, post-taxes, to cover health care expenses in retirement. This doesn’t include expenses like over-the-counter medicines, most dental services and long-term care. (Fidelity, 2022)
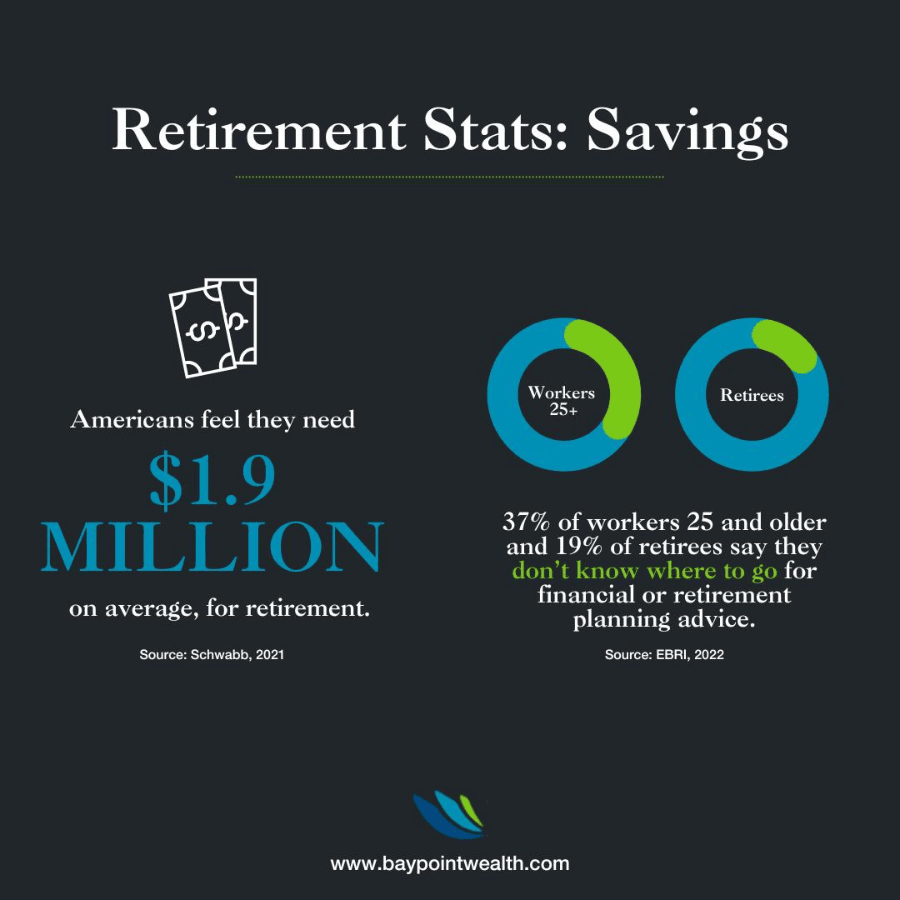
- 37% of workers 25 and older and 19% of retirees say they don’t know where to go for financial or retirement planning advice. (EBRI, 2022)
- 82% of workers offered an employer-sponsored retirement savings plan are somewhat or very satisfied with the benefit. (EBRI, 2022)
- The total value of IRA and Keogh accounts was $924.6 billion in April 2022, compared with $969.1 billion in April 2021, a decrease of 5%. (FRED, 2021)
- At their peak in January 2021, IRA and Keough accounts had a total value of $986.9 billion. (FRED, 2021)
- Americans feel they need $1.9 million, on average, for retirement. (Schwabb, 2021)
- Nearly 7 in 10 (67%) Americans between ages 50 and 74 don’t have a formal retirement plan, while four in five lack retirement planning basics on how to be financially secure. (The American College, 2020)
- A recent survey found that 27% of savers have stopped or reduced their retirement savings, and 9% have drawn down cash from their retirement account. (Finance Buzz, 2020)
- 51% of employers automatically enrolled new or existing employees into a 401(k) plan in 2020, up 8 percentage points from 43% in 2019. (SHRM, 2020)
- 72% of employers offer hardship withdrawals in 2020, up 18 percentage points from 54% in 2019. (SHRM, 2020)
- 68% of private industry workers had access to retirement plans in 2021. (U.S. Bureau of Labor Statistics, 2021)
- 67% of private industry workers had access to retirement plans in 2020. (U.S. Bureau of Labor Statistics, 2021)
- Union workers were more likely than nonunion workers to have retirement benefits in 2019. (U.S. Bureau of Labor Statistics, 2019)
- 68% are saving for retirement through a workplace plan and/or outside of work in an IRA, mutual fund, bank account, etc. Women who are saving for retirement started doing so at age 27 (median). (Transamerica Center, 2019)
- Paying off debt is a financial priority for almost two-thirds of women (65%). Only 49% of women cite saving for retirement as a priority. (Transamerica Center, 2019)
- 61% of women are offered a 401(k) or similar employee-funded retirement plan. However, 30% of women work part-time so are less likely to have workplace retirement benefits. (Transamerica Center, 2019)
- Among women who are offered a 401(k) or similar plan, 73% participate in the plan and they contribute 8% (median) of their salary to the plan. (TransAmerica Center, 2019)
- Women’s total household retirement savings is only $23,000 (estimated median). (Transamerica Center, 2019)
- Women believe they will need to save $500,000 (median) in order to feel financially secure in retirement; among those who estimated their savings needs, 54% say they guessed at the figure. (Transamerica Center, 2019)
- Only 15% of women have a written retirement strategy; 42% have an unwritten strategy. (Transamerica Center, 2019)
- 37% of women use a professional financial advisor to help manage their retirement savings and investments. (Transamerica Center, 2019)
- Just 29% of women are aware of the Saver’s Credit, a tax credit for saving for retirement. (Transamerica Center, 2019)
- Few women (14%) frequently discuss saving, investing, and planning for retirement with family and close friends. (Transamerica Center, 2019)
- 49% of adults ages 55 to 66 had no personal retirement savings in 2017. (U.S. Census Bureau, 2017)
- Of those who married once, about 35% have no retirement savings, compared to 60% of those who never married and 40% of those who married more than once. (U.S. Census Bureau, 2018)
- 4 in 10 of those who married once have $100,000 or more in retirement savings, compared to 2 in 10 of those who never married and 1 in 3 of those who married two or more times. (U.S. Census Bureau, 2018)
- Among both men and women, adults married once are less likely to have no retirement savings and more likely to have $100,000 or more in retirement savings, compared to those who have never been married and those who have been married two or more times. (U.S. Census Bureau, 2018)
- Compared to approximately 36% of adults who have children with one partner, referred to as single-partner fertility (SPF), a larger percentage of those who have no children (about 42%) and those with multiple-partner fertility (MPF) (about 49%) have no retirement savings. (U.S. Census Bureau, 2018)
- Furthermore, adults who have children with a single partner are also more likely to have $100,000 or more in retirement savings than their counterparts with other fertility histories. (U.S. Census Bureau, 2018)
- A smaller percentage of men who have children with one partner have no retirement savings and a larger percentage have $100,000 or more in retirement savings, compared to those with no children and those who have children with multiple partners. (U.S. Census Bureau, 2018)
- Women who have children with a single partner are more likely to have no retirement savings than the women who have no children (38.2% compared to 34.2%). Among those who do have retirement savings, the women with no children do not differ from those who have children with a single partner. (U.S. Census Bureau, 2018)
- Among adults who have never married, those who have children with a single partner are more likely to have no retirement savings than those with no children (72.7% compared to 52.7%). (U.S. Census Bureau, 2018)
- In addition, a larger percentage of never-married adults who have children with multiple partners have no retirement savings than never married parents with a single partner (81.7% compared to 72.7%). (U.S. Census Bureau, 2018)
Social Security
- 57% of retired U.S. adults say they rely on Social Security as a major income source, compared with 38% of non-retirees who expect to do the same. (Gallup, 2021)
- 69.8 million people received benefits from programs administered by the Social Security Administration (SSA) in 2020. Retired workers and their dependents accounted for 75.2% of total benefits paid in 2020. (Social Security Administration, 2021)
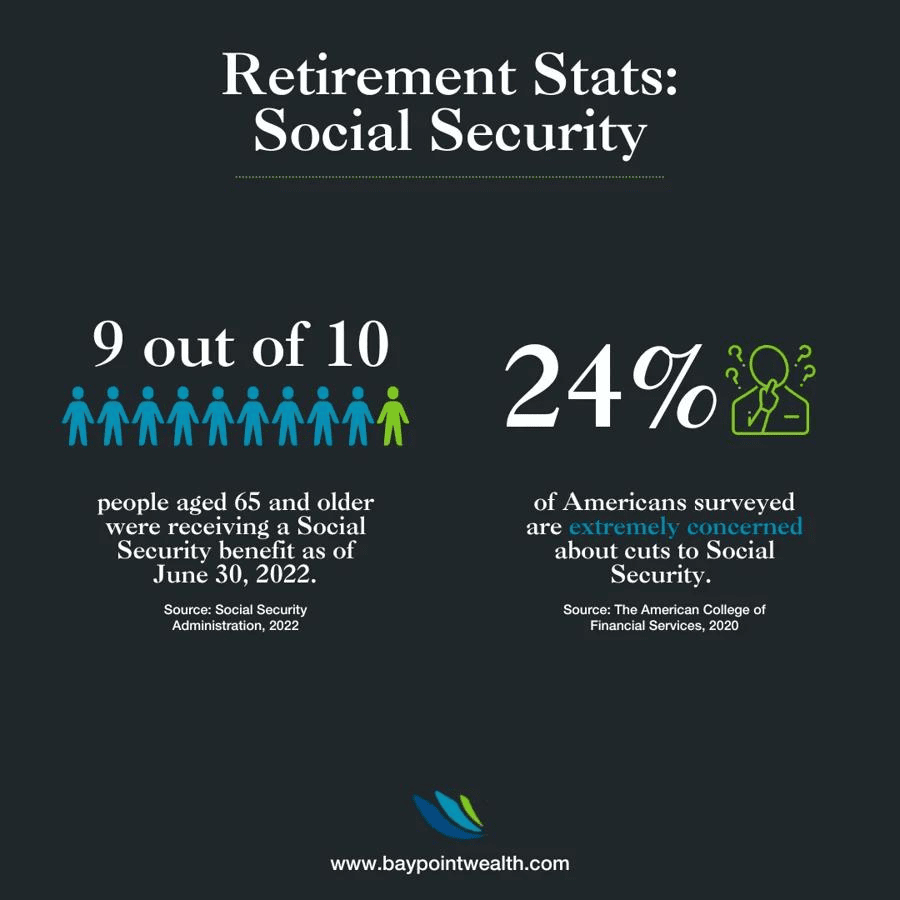
- 24% of Americans surveyed are extremely concerned about cuts to Social Security. (The American College of Financial Services, 2020)
- 32% of women expect Social Security to be their primary source of retirement income. (Transamerica Center, 2019)
- 69.1 million people received benefits from programs administered by the Social Security Administration (SSA) in 2019. (Social Security Administration, 2019)
- 5.7 million people were newly awarded Social Security benefits in 2019. (Social Security Administration, 2019)
- 55% of adult Social Security beneficiaries in 2019 were women. (Social Security Administration, 2019)
- 49 was the average age of disabled-worker beneficiaries in 2019. (Social Security Administration, 2019)
- 86% of Supplemental Security Income (SSI) recipients received payments because of disability or blindness in 2019. (Social Security Administration, 2019)
- Nearly nine out of ten people aged 65 and older were receiving a Social Security benefit as of June 30, 2022. (Social Security Administration, 2022)
- Social Security benefits represent about 30% of the income of the elderly. (Social Security Administration, 2022)
- Among elderly Social Security beneficiaries, 37% of men and 42% of women receive 50% or more of their income from Social Security. (Social Security Administration, 2022)
- Among elderly Social Security beneficiaries, 12% of men and 15% of women rely on Social Security for 90% or more of their income. (Social Security Administration, 2022)
Spending
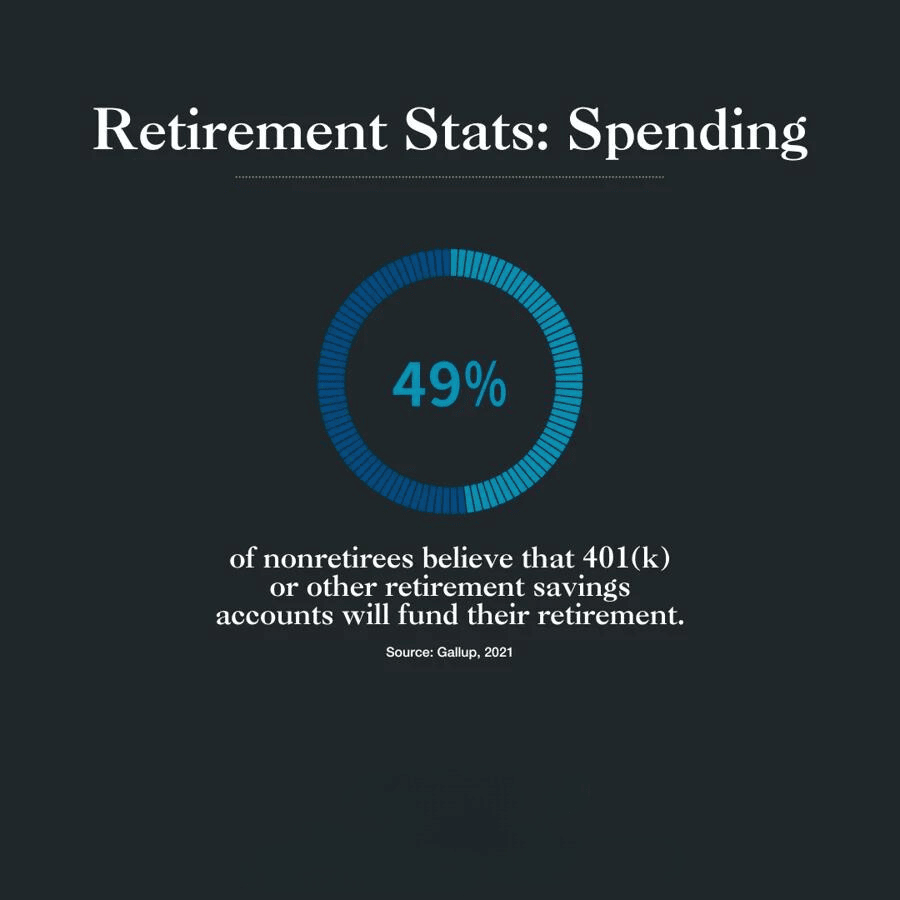
- 49% of nonretirees believe that 401(k) or other retirement savings accounts will fund their retirement. (Gallup, 2021)
- Lump sums are the most common payment option for participants in defined contribution retirement plans. (U.S. Bureau of Labor Statistics, 2018)
Retire Smarter With A Plan In Focus
The stats we’ve unspooled here illustrate a fascinating retirement narrative: everybody appears to be doing something different from the next person. that’s why, in light of possible confusion over financial planning, we recommend that you consult with an objective and experienced financial expert for added perspective. Retirement planning comes with a lot of moving parts; an expert in this area understands how they’ll mesh within your unique situation, and can help you devise the best plan to meet your goals.
Lastly, a word of encouragement: retirement planning is a positive process, which uses intentional decision making as a way to stay in control of your own destiny. When you plan, you build financial security and create the freedom to pursue your goals, even if it’s little by little. And if you ever want to talk about your retirement concerns or questions, reach out to the experts here at Curio Wealth.
Sources (in alphabetical order)
- AHCA, 2022 – https://www.ahcancal.org/Pages/default.aspx
- American Progress, 2019 – https://www.americanprogress.org/issues/race/reports/2016/12/20/295359/wealth-inequality-among-asian-americans-greater-than-among-whites/
- Center for Retirement Research at Boston College, 2016 – https://crr.bc.edu/briefs/social-security-is-a-great-equalizer/
- CNBC, 2020 – https://www.cnbc.com/2020/01/17/heres-where-most-americans-are-really-getting-their-retirement-income.html
- EBRI, 2022 – https://www.ebri.org/retirement/retirement-confidence-survey
- EPI, 2019 – https://www.epi.org/publication/the-state-of-american-retirement-savings/
- Fidelity, 2022 – https://www.businesswire.com/news/home/20220516005224/en/Fidelity-Releases-2022-Retiree-Health-Care-Cost-Estimate-65-Year-Old-Couple-Retiring-Today-Will-Need-an-Average-of-315000-for-Medical-Expenses
- Finance Buzz, 2020 – https://financebuzz.com/retirement-survey-2020
- FRED, 2021 – https://fred.stlouisfed.org/
- Gallup, 2021 – https://news.gallup.com/poll/350048/retirees-experience-differs-nonretirees-outlook.aspx
- Gallup, 2021 – https://news.gallup.com/poll/392162/personal-finance-ratings-slide-amid-rising-prices.aspx
- Mercer, 2021 – https://www.mercer.com/our-thinking/global-pension-index-2021.html
- National Institute on Retirement Security, 2013 – https://www.nirsonline.org/reports/race-and-retirement-insecurity-in-the-united-states/
- National Institute on Retirement Security, 2013 – https://www.shrm.org/ResourcesAndTools/hr-topics/employee-relations/Documents/race_and_retirement_insecurity_final.pdf
- Natixis, 2021 – https://www.im.natixis.com/us/research/2021-global-retirement-index
- NIC, 2021 – https://www.nic.org/news-press/u-s-seniors-housing-occupancy-reaches-new-low/
- Pew Research Center, 2021 – https://www.pewresearch.org/fact-tank/2021/12/17/striking-findings-from-2021/
- Sage Journals, 2019 – https://journals.sagepub.com/doi/full/10.1177/0034644619843529
- Schwabb, 2021 – https://www.aboutschwab.com/schwab-401k-participant-survey-2021
- Senate- Joint Economic Committee, 2016 – https://www.jec.senate.gov/public/_cache/files/bafb9923-7f9a-40ad-b287-4722b8b979cd/retirement-insecurity-jec.pdf
- SHRM, 2020 – https://www.shrm.org/hr-today/trends-and-forecasting/research-and-surveys/pages/benefits-report.aspx
- Social Security Administration, 2019 – https://www.ssa.gov/policy/docs/chartbooks/fast_facts/2020/fast_facts20.html#:~:text=5.7%20million%20people%20were%20newly,disability%20or%20blindness%20in%202019
- Social Security Administration, 2021 – https://www.ssa.gov/news/press/factsheets/colafacts2021.pdf
- Social Security Administration, 2022 – https://www.ssa.gov/news/press/factsheets/basicfact-alt.pdf
- Social Security Administration, 2022 – https://www.ssa.gov/OACT/population/longevity.html
- Statista, 2020 –